Commercial construction costs across Australia are continuing to move in 2025, and these shifts are shaping how owners, investors, and developers plan new projects. Labour shortages, changing material price indices, and ongoing escalation from 2024 into 2025 all play a major role in determining the final commercial cost per m². Industry sources such as Rawlinsons, CoreLogic, and the ABS show consistent upward pressure across key building trades, particularly in structure, concrete, façade systems, and mechanical services.
These cost movements affect every building type differently. Offices, warehouses, retail, healthcare, and hospitality all follow different cost patterns based on service intensity, design complexity, and market demand. Understanding commercial construction cost per square metre 2025 benchmarks is essential for building realistic budgets, controlling risk, and planning with confidence.
Understanding Cost Per m²: What’s Actually Included?
Commercial building costs in Australia are often discussed in terms of cost per m², but this number only makes sense when you understand what’s actually included. At AS Estimation & Consultants, we break this down clearly so owners and developers can plan with confidence and avoid hidden surprises.
Cost per m² usually covers the base build, the shell and core, and key building services. Fit-out levels, façade choices, and plant requirements all influence the final figure. A clear breakdown helps you see where your budget is going and why costs shift between projects.
Key Components Included in Cost Per m²
- Base Build Costs – Covers the structural frame, slab, roof, and primary elements that form the building’s core structure.
- Shell & Core Works – Includes façades, glazing, stairwells, lifts, and shared areas, forming the building’s functional envelope.
- Fit-Out Costs – Depends on whether the project is warm shell, cold shell, or turnkey, influencing finishes and internal services.
- Façade & Services Breakdown – Factors in façade systems, MEP/HVAC installations, and fire protection based on performance needs.
- External Works – Accounts for access roads, site establishment, and any landscaping or service connections tied to the project footprint.
Cost Benchmarks by Commercial Building Type (2025)
Cost benchmarks vary widely across commercial building types in Australia, and understanding these differences is essential when planning for 2025. Each asset category has its own cost drivers, service needs, and design requirements, which is why cost per m² can shift so noticeably from one sector to another.
Grade A & Grade B Office Buildings
Grade A offices generally cost more because they require higher-performance façades, premium HVAC systems, and better vertical transport. Grade B offices sit lower due to simpler finishes and lighter services. These differences shape the average office build cost in Australia, especially when comparing Grade A office cost benchmarks across major cities.
Retail Buildings & Fit-Out Intensive Assets
Retail spaces—whether in shopping centres or on street-front locations—carry heavier fit-out costs. Restaurants, in particular, demand strong MEP capacity, commercial kitchens, and upgraded ventilation. A clear retail fit-out cost guide helps explain how these service-heavy elements push costs higher than standard retail shells.
Industrial & Warehouse Buildings
Warehouses typically feature large spans, simple structures, and minimal services, making them more cost-efficient per m². Many are delivered through D&C procurement, which keeps pricing predictable. However, location and clear height still impact the warehouse cost per m² in 2025, especially for logistics-focused builds.
Hotels & Hospitality
Hotels split their costs between guestroom areas and back-of-house operations. While rooms follow repetitive layouts, services like hot water systems, laundry facilities, and kitchen infrastructure significantly increase complexity. This is why hotel construction costs in Australia often rate higher than standard commercial projects.
Hospitals, Healthcare & Laboratories
Healthcare facilities are among the most expensive due to strict compliance requirements and redundant MEP systems. Spaces like operating theatres, labs, and imaging rooms require specialised services and high-quality finishes. As a result, hospital and healthcare build costs sit at the upper end of commercial benchmarks.
Education Facilities (Schools & Universities)
Education buildings vary depending on classroom, administration, or laboratory needs. Labs and technical spaces demand more services and equipment, while classrooms remain simpler. These variations influence the education facility cost per m², especially in new university or STEM-focused builds.
Cost Drivers in Commercial Projects (2025 Edition)
Understanding the key cost drivers is essential when reviewing commercial building cost per m² in 2025. Labour rates, material price movements, and market pressures continue to shape project budgets across Australia. These forces influence how contractors price work and how developers should plan their contingencies.
Labour shortages, energy volatility, and regulatory compliance all contribute to shifting cost patterns. By identifying these early, you can better manage risks, refine estimates, and avoid unexpected overruns during delivery.
Main Cost Drivers in 2025
- Labour Rates – Ongoing shortages in skilled trades are increasing hourly rates and extending program durations.
- Materials Inflation – Steel, concrete, and façade materials continue to fluctuate due to global supply constraints and rising freight costs.
- Energy Market Volatility – Higher energy prices affect manufacturing, transport, and on-site preliminaries.
- Regulatory Pressures – New safety, fire, and environmental standards add cost layers through upgraded materials and documentation.
- Preliminaries & Overheads – Site setups, compliance, and management costs remain elevated due to longer programs and tighter regulations.
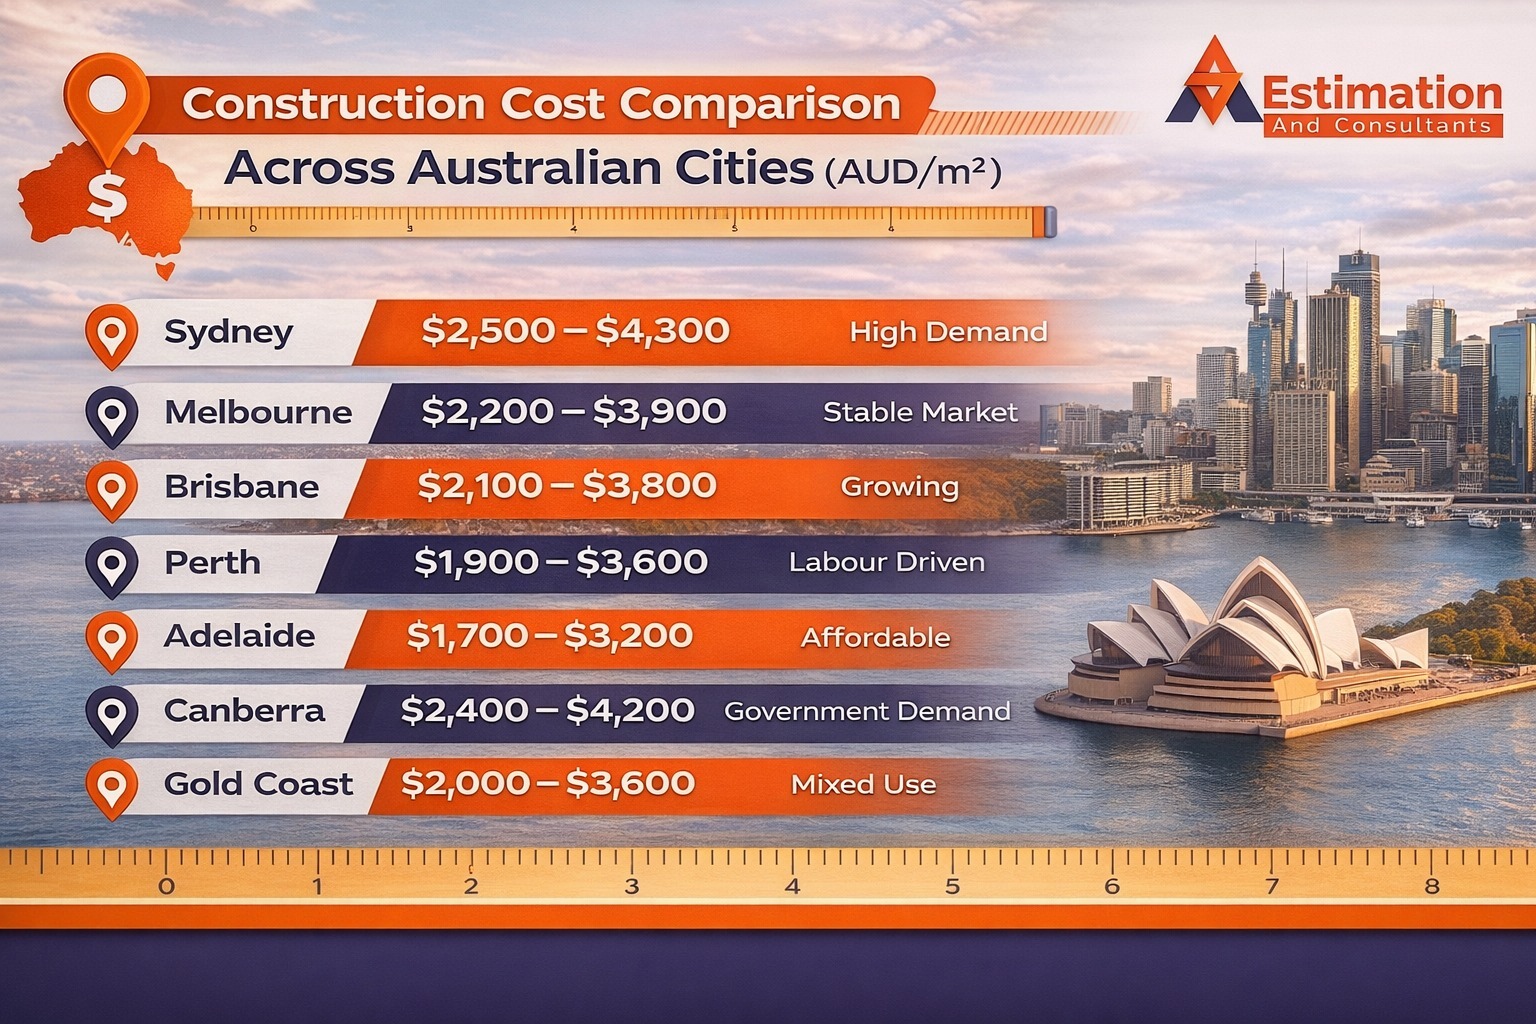
Regional vs Metro Construction Costs Across Australia
Construction costs vary significantly across Australia, and these differences can shift your cost per m² more than most people expect. Major cities often carry higher labour rates and stronger demand, while regional areas face transport, logistics, and subcontractor availability challenges.
Understanding how each location differs helps owners and developers budget with more accuracy, especially when planning for 2025.
Metro vs Regional Cost Comparison (Indicative Index Only)
(Metro = 100 baseline)
| Location | Metro/Regional Classification | Relative Cost Index | Key Cost Factors |
| Sydney | Metro | 100 | High labour rates, strong demand |
| Melbourne | Metro | 97–100 | Competitive market but rising services costs |
| Brisbane | Metro | 92–95 | Stable labour market, strong subcontractor base |
| Perth | Metro | 95–98 | Freight distance and material imports |
| Adelaide | Metro | 85–90 | Smaller market, generally lower pricing |
| Regional NSW | Regional | 105–115 | Transport, accommodation, limited trades |
| Regional QLD | Regional | 103–112 | Distance + lower competition |
| WA Regional / Pilbara | Regional | 120–150+ | Extreme logistics + specialist labour |
(This is an illustrative index—project specifics vary.)
Regional vs Metro Cost Factors
- Capital City Pressures – Sydney and Melbourne usually lead due to higher labour rates and strong competition for trades.
- Brisbane & SEQ Trends – Slightly lower due to more balanced supply and demand.
- Perth vs Adelaide Differences – Perth carries freight impacts; Adelaide offers more predictable pricing.
- Regional Loading – Transport, accommodation, and subcontractor scarcity increase total project costs.
- Site Works Variation – External works change dramatically based on soil conditions and service availability.
Sustainability, NABERS & Green Star: How Ratings Influence 2025 Costs
Sustainability targets are shaping commercial construction costs more than ever in 2025. Higher NABERS scores and Green Star ratings require better materials, smarter services, and stronger building envelopes. While these upgrades increase upfront costs, they also improve long-term performance and reduce operational expenses for owners and tenants.
Developers aiming for Green Star 5 or 6 often face additional investment in façades, HVAC systems, and energy-efficient technologies. Understanding these sustainable design cost premiums helps project teams set realistic budgets and meet compliance requirements without surprises.
How Sustainability Ratings Influence Costs
- Green Star 5/6 Uplift – Higher certification levels require advanced materials, strict documentation, and enhanced performance modelling.
- NABERS Energy Goals – Better energy ratings drive upgrades in mechanical systems, lighting design, and smart controls.
- Façade Performance Requirements – Improved glazing, insulation, and shading systems increase upfront costs but reduce long-term energy use.
- Efficient HVAC Systems – High-efficiency chillers, VRF systems, and heat-recovery add capital cost but improve lifecycle value.
- Sustainable Material Selection – Low-VOC finishes, recycled content, and responsible sourcing contribute to higher early-stage budgets.
Preliminaries, Overheads & Professional Fees
Preliminaries, overheads, and professional fees form a significant part of a commercial project’s total cost, even though they’re not visible in the finished building. These soft costs cover everything needed to manage, design, and legally deliver the project, and they directly influence the final cost per m².
From consultants to site establishment, these elements ensure the project runs smoothly and meets Australian standards. Understanding them upfront helps developers plan more accurately and avoid unexpected budget gaps during construction.
Key Soft Cost Components
- Consultant Fees – Architects, engineers, certifiers, and specialist advisors who develop and coordinate the design.
- Project Management – Costs for overseeing the program, managing risks, and maintaining quality throughout delivery.
- Statutory Approvals – Fees for permits, certifications, environmental reports, and compliance documentation.
- Site Establishment – Temporary fencing, amenities, utilities, and safety measures included in preliminaries and site establishment costs.
- Overheads – Contractor business costs such as administration, insurance, and supervision embedded in the construction process.
Risk, Contingency & Escalation: How to Budget Accurately for 2025
Managing uncertainty is one of the most important parts of commercial cost planning in Australia. With tender pricing shifting, labour availability changing, and materials still affected by global supply pressures, the smartest budgets in 2025 are the ones that intentionally allow room for the unexpected.
At AS Estimation & Consultants, we treat risk, contingency, and escalation as structured planning tools—not guesswork. When these are defined early and tracked properly, they protect a project from sudden cost shocks and help keep budgets steady as designs evolve.
Key Elements for Accurate 2025 Budget Planning
| Cost Control Element | What It Means | Why It Matters in 2025 |
| Cost Escalation Allowance | An allowance added to cover forecasted construction price increases | Escalation for 2025 remains volatile due to labour and materials pressure |
| Risk Register | A simple list of risks, their impact, and mitigation steps | Helps owners see where unknowns might increase cost |
| Contingency Buffer | A percentage set aside for unforeseen scope changes or conditions | Essential when dealing with early-stage designs and unknown site conditions |
| Tender Price Volatility | Shifts in contractor pricing caused by market demand | Subcontractor shortages can push prices higher at short notice |
How to Apply These in Real Projects (AS Style)
- Cost Escalation Allowances
Set realistic escalation percentages based on the latest escalation 2025 forecasts. This avoids budget gaps caused by rising labour or material costs. - Risk Registers
List every meaningful risk—design changes, site surprises, service upgrades—and assign each a probability and cost impact. This creates clear visibility of contingency and risk. - Contingency Buffers
Early design stages need higher contingency (10–20%), while detailed designs may reduce this. Strong cost planning uses contingency allowances and risk as flexible tools, not fixed numbers. - Tender Pricing Variability
Understand that subcontractor pricing can shift based on workload, location, and availability. Knowing tender pricing strategies in 2025 helps predict where cost pressure may appear.
Why This Matters for Commercial Budgets in 2025
Projects that build in escalation, track risks, and allocate proper contingency consistently deliver closer to budget. Those that don’t face large overruns, delayed approvals, and contract disputes. In a market still adjusting to labour and material pressures, structured cost planning isn’t optional—it’s protection.
Tender Market Conditions in 2025
Tender conditions across Australia continue to influence commercial building cost per m² more than most people realise. As contractor workloads fluctuate and subcontractor availability tightens, tender pricing becomes less predictable. Understanding these shifts early allows developers to prepare budgets that accurately reflect real market behaviour in 2025.
At AS Estimation & Consultants, we track tender movements closely because they directly affect the final construction rate a client pays. When workloads are high or skilled trades are limited, tender prices rise—pushing cost per m² above initial estimates. This insight helps owners plan with clarity instead of reacting to late-stage pricing surprises.
How Tender Pricing Behaves in 2025
1. High Workload = Risk-Loaded Tenders
Busy contractors price more cautiously, adding risk allowances and higher markups. These increases directly lift the final cost per m² a client sees at tender award.
2. Subcontractor Shortages
Critical trades remain in short supply, leading to elevated labour rates and fewer competitive bids. This drives up the cost per m² for services-heavy buildings.
3. Early Engagement Strategies
Bringing contractors and key subcontractors into the design process helps stabilise pricing. Early engagement reduces unknowns and provides more accurate market feedback during cost planning.
What’s Driving This Market Behaviour?
| Tender Pressure | Cause | Impact on Cost Per m² |
| High Contractor Workload | Strong pipeline of commercial work | Higher risk margins and increased rates |
| Labour Rate Increases | Shortage of skilled trades | Higher labour costs across all building types |
| Material Lead Time Risks | Global freight and manufacturing delays | Contractors include buffers and provisional sums |
| Low Subcontractor Competition | Limited availability of specialist trades | Loss of competitive pricing, raising unit rates |
Why This Matters for 2025 Budgets
Tender volatility is one of the biggest drivers behind unexpected increases in commercial building cost per m². When owners understand tender pricing strategies in 2025—and plan for labour rate shifts, risk loadings, and subcontractor shortages—they can prepare stronger cost plans and avoid last-minute budget overruns.
Practical Cost Planning Framework for Developers & Owners
Building a reliable cost plan in 2025 requires more than a single cost-per-m² figure. It needs structure, current benchmarks, and a process that adapts as the design develops. A strong cost plan protects the project from escalation, scope changes, and unexpected site conditions—while giving owners clear visibility from day one.
At AS Estimation & Consultants, we approach cost planning as a step-by-step system. By using the right documents, realistic allowance ranges, and consistent updates, developers can keep control of cost drivers and manage uncertainties long before they impact the bottom line.
Step-by-Step Cost Planning Process
- Define the Project Scope Early
Outline building type, performance requirements, façade expectations, internal finishes, and sustainability targets. These decisions shape the initial cost per m² range. - Build the First Cost Model
Use current 2025 cost benchmarks to develop a preliminary estimate. Include base build, services, site works, and early professional fees. - Add Allowances & Contingency Buffers
Include allowances for design development, scope refinement, and unknown conditions. Contingency should reflect project stage—higher early on, reducing as details become clearer. - Apply Escalation Factors
Use realistic escalation and indexation in 2025 to account for labour and material shifts. This prevents budget gaps at tender stage.
5. Update the Estimate at Each Design Milestone
Cost plans should be updated at concept, schematic, design development, and pre-tender stages. This ensures the estimate stays aligned with actual project decisions.
Key Documents Required for Accurate Cost Planning
- Concept Plans & Massing Diagrams – Define building size and form.
- Performance Brief – Outlines façade, HVAC, sustainability, and service expectations.
- Site Information – Soil reports, access constraints, service connections.
- Consultant Inputs – Structural, services, and architectural details.
- Risk Register – Identifies potential cost exposures early.
Recommended Allowance Ranges (2025)
| Allowance Type | Typical Range | Purpose |
| Design Contingency | 10–20% | Covers incomplete design details |
| Construction Contingency | 5–10% | Manages unforeseen site conditions |
| Escalation Allowance | Project-specific | Addresses forecasted market shifts |
| Professional Fees | 8–12% of total cost | Includes architects, engineers, certifiers |
Why This Framework Matters
Clear cost planning puts developers in control. With well-structured estimates, realistic allowances, and regular updates, owners can make confident decisions and stay ahead of cost drivers in commercial projects. In a market shaped by ongoing pricing pressures, this framework helps ensure the final cost per m² remains aligned with early expectations.
Case Studies: Real-World Commercial Projects in Australia
Real examples help show how commercial construction cost per m² behaves in practice. Each project type has its own structure, service load, and design requirements, which influence its final rate. These short case studies highlight how different cost drivers shape outcomes in the Australian market.
Office Building Example
A mid-rise Grade B office in Melbourne included a concrete structural frame, standard glazing, and efficient HVAC. Its pricing aligned closely with typical commercial construction cost per square metre 2025, with façade choices playing the biggest role in the final cost.
Industrial Warehouse Example
A logistics warehouse in Brisbane used large-span steel framing and minimal services. With simple finishes and efficient design, its cost per m² remained on the lower end, driven mainly by structure and slab requirements.
Hospitality Fit-Out Example
A hotel refurbishment in Sydney involved upgraded façade systems, premium finishes, and services-intensive back-of-house areas. These additions pushed the cost per m² higher, reflecting the complexity of hospitality projects.
FAQs
The average cost per m² depends on the building type, location, and level of services. Offices, warehouses, retail, hotels, and healthcare all sit in different ranges. Most projects start with benchmark costs and are refined as design details become clearer.
Costs differ because labour rates, freight distances, subcontractor availability, and local market competition change from region to region. Metro areas usually have more competitive pricing, while regional projects often include additional logistics and travel loadings.
Labour shortages, materials inflation, upgraded façade systems, complex HVAC, and higher sustainability targets can all increase the final cost per m². Tender market pressure—especially when contractors are busy—also raises pricing.
It’s best to build a cost plan at concept stage and update it every time design progresses. Early planning helps manage risk, set realistic allowances, and keep the project aligned with 2025 benchmarks.
Cost per m² usually includes the base build, structure, façade, services, and external works. Fit-out levels, specialist equipment, and some approvals may sit outside the initial rate and need to be priced separately.
Yes, higher sustainability ratings usually add upfront cost through improved façades, efficient HVAC, and energy-focused upgrades. However, they reduce long-term operational costs and often increase asset value.
Conclusion
Commercial construction in Australia is entering another year shaped by shifting labour rates, material movements, and tighter sustainability requirements. For owners and developers, the path to certainty in 2025 is built on early planning, structured cost reviews, and a clear understanding of how each design decision affects the final cost per m².
Reliable budgets now rely on strong risk management, realistic contingencies, and regular updates as the project progresses. By planning early and responding to live market conditions, developers can protect their projects from unexpected escalation and stay aligned with real construction cost Australia 2025 trends.
In a market where prices continue to move, the best advantage is clarity—using accurate benchmarks, well-defined scopes, and informed decisions from day one.