Australian construction costs in 2026–2027 won’t move in a straight line. Some packages will settle, others will keep climbing, and tender behaviour can change pricing faster than most people expect. If you’re setting budgets, pricing tenders, or checking feasibility, you need a decision-grade view of construction cost trends in Australia—not headlines or guesswork.
This guide gives you a practical way to use cost forecasting 2026–2027. You’ll learn what’s driving the future construction pricing outlook, how the tender price index differs from final project cost, and why costs diverge by sector and region. You’ll also get clear estimating actions to protect estimating accuracy, plus simple risk triggers to watch so your building cost outlook 2026–2027 stays current as conditions shift.

How To Read Cost Forecasts (So You Don’t Misuse Them)
Cost forecasts for 2026–2027 are planning tools, not promises. Start by checking definitions and scope boundaries: is the forecast talking about tender price indexes in Australia or final delivered cost? A tender price index reflects what builders price today, including risk and margins. Final cost can change due to design changes, delays, and procurement timing. Use forecasts as ranges, not point numbers, and apply them with a clear escalation methodology so your estimating accuracy improves, not slips.
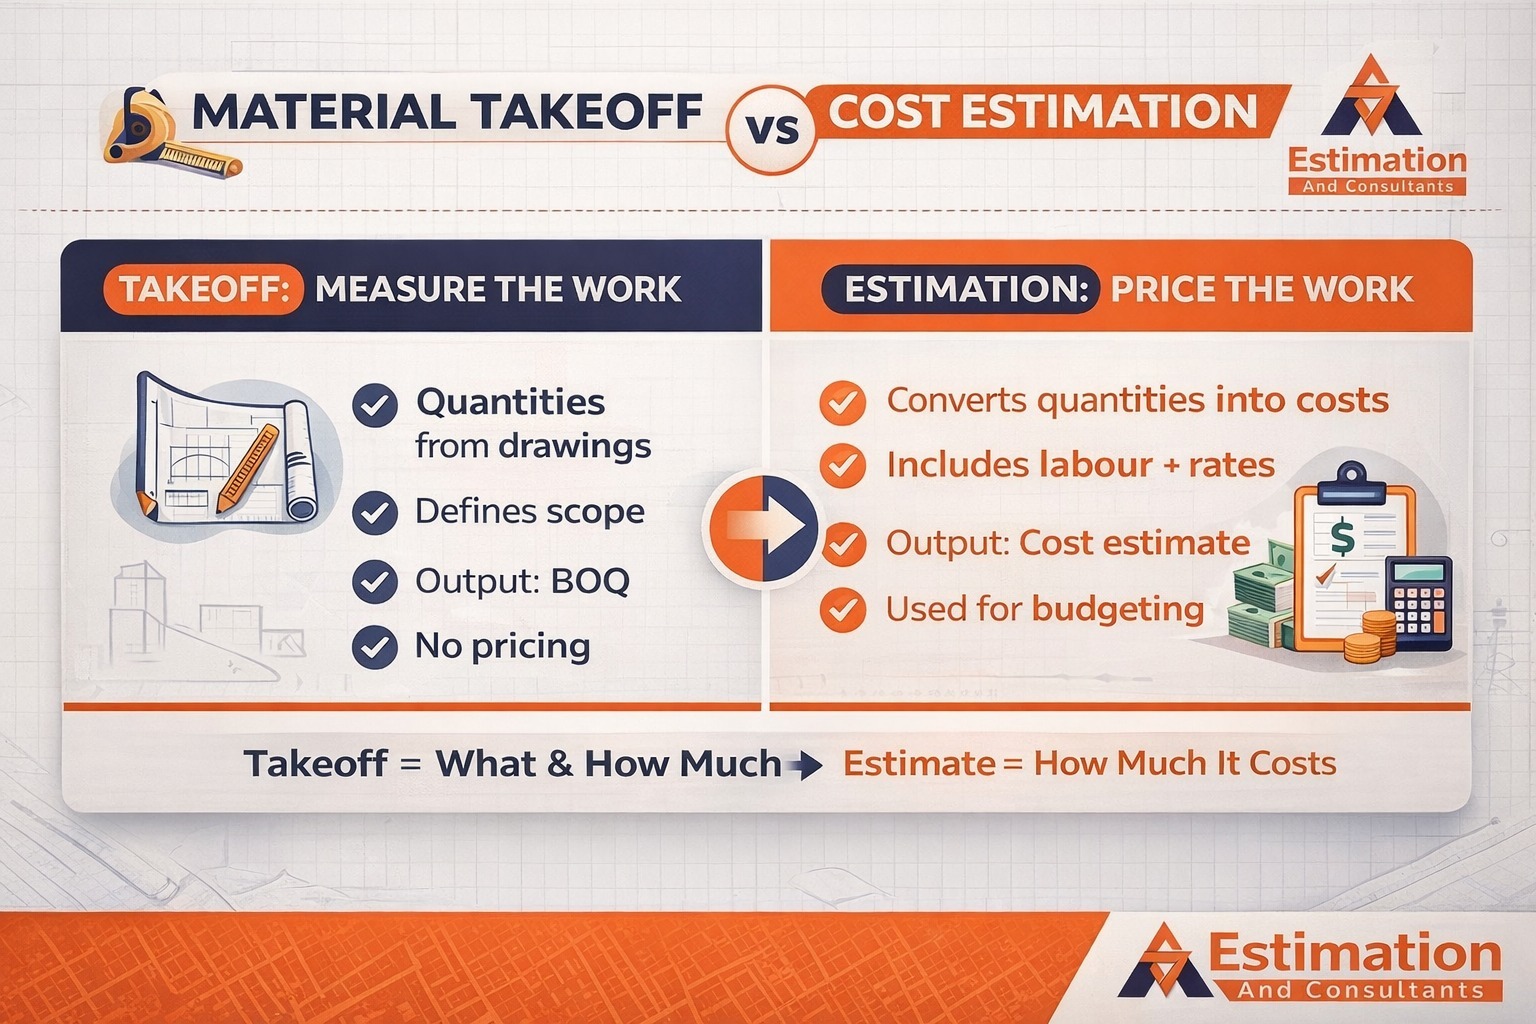
Tender Price Vs Final Cost, Location Factors, Preliminaries, And Escalation Vs Volatility
When you read a forecast, ask what it includes and what it leaves out. “Tender price vs construction cost” is the most common confusion. Tender prices often include preliminaries, risk allowances, and contractor margin adjustments, while “construction cost” figures you see elsewhere may only track inputs. Location factors also matter in Australia—regional logistics, labour availability, and site access can shift pricing. And don’t mix up escalation (a steady upward drift) with volatility (sharp swings). For cost estimating implications 2026–2027, you want allowances that match the type of movement you’re facing.
Use this quick check:
- Scope: What’s included in the forecast?
- Index: Is it tender price index or input cost only?
- Location: Metro vs regional loading?
- Movement type: Escalation or volatility?
- Range: Band of outcomes, not one number
What’s In The Cost Stack: Inputs, Prelims, Risk, Margin
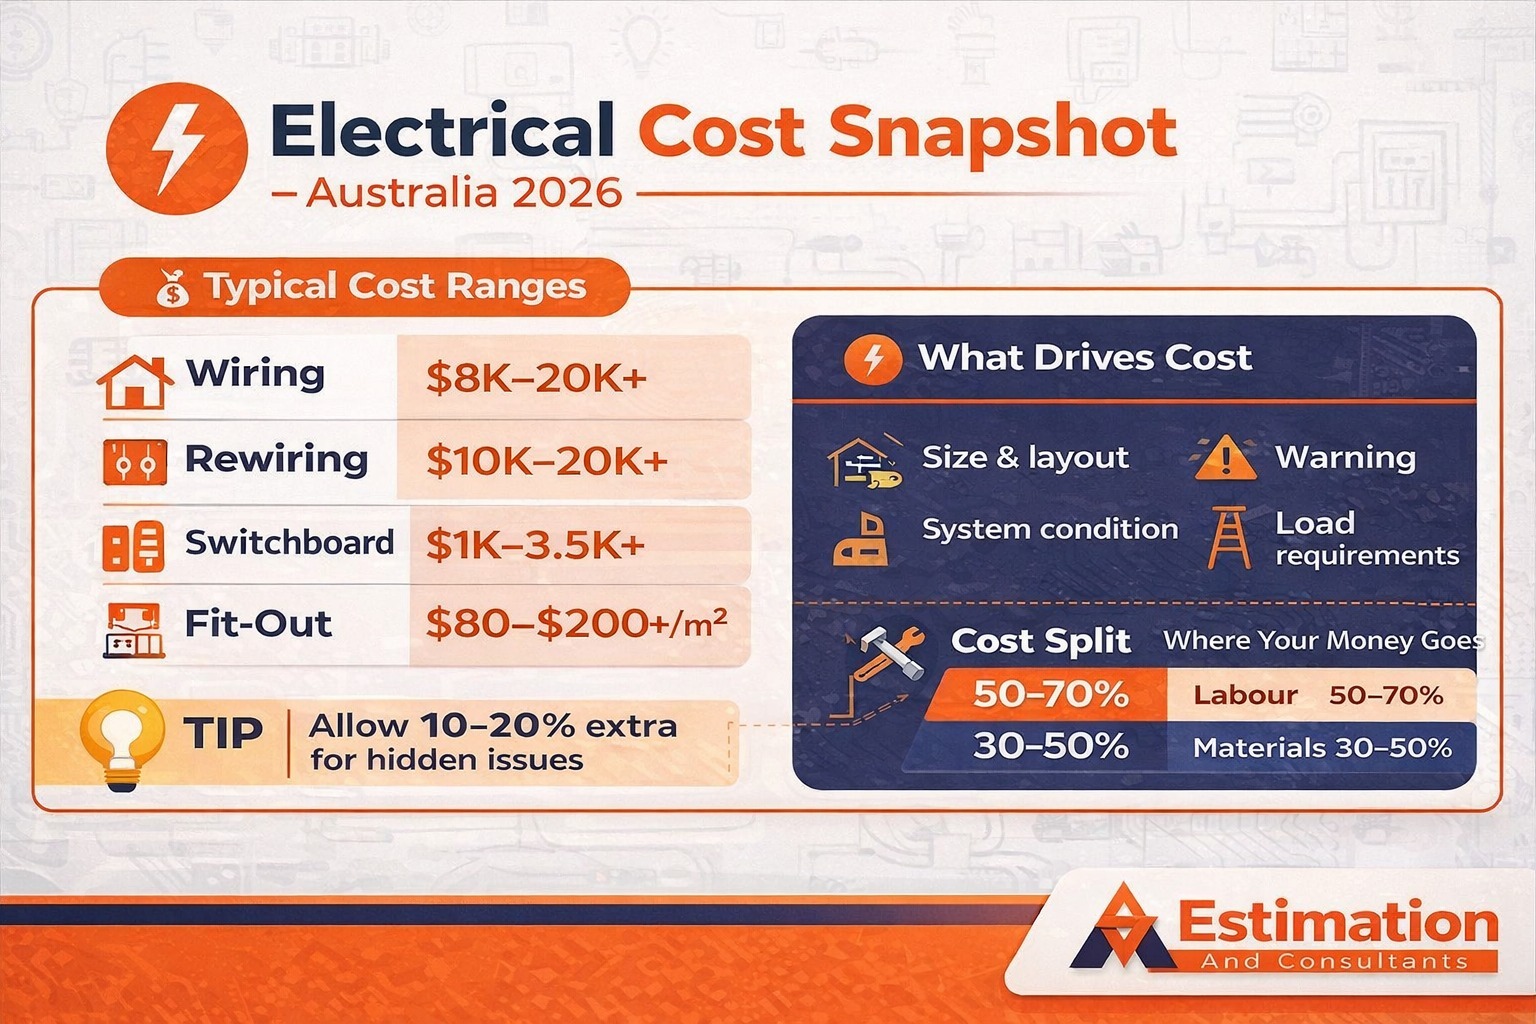
Costs don’t fall quickly because the price you receive in a tender is a stack, not a single line item. Inputs move first, but the other layers can stay high even when material prices cool. For 2026–2027, building cost inflation in Australia is likely to be driven as much by labour rate changes, site overheads, and risk pricing as by materials cost inflation. If you understand the cost build-up, you’ll stop expecting cost drops just because one material category eases, and your pricing structure will be more realistic.
Inputs: Labour And Materials
Inputs are the base layer—labour and materials. Materials cost inflation can ease when supply stabilises, but it can also spike again due to freight, energy, or spec changes. Labour rate changes tend to be stickier because wages and trade availability don’t reset quickly. In Australia, labour often drives ongoing upward pressure, especially on busy programs and labour-heavy trades. If your forecast assumes materials will soften, you still need to test whether labour and productivity trends support that assumption for 2026–2027.
Prelims: Site, Supervision, And Time On The Job
Preliminaries are the “cost of running the site.” Think supervision, site setup, amenities, scaffolding time, traffic control, safety, and program duration. Prelims rise when jobs take longer, when labour is harder to coordinate, or when access is tight. This is where location factors bite—regional builds can carry extra supervision and logistics time, while metro builds can suffer from access constraints and staging. Prelims are a major reason tender prices stay firm even when certain materials stop rising.
Risk: Allowances That Protect The Builder (And The Project)
Risk allowances show up when there is uncertainty—unknown ground conditions, long lead times, design not locked, or a tight market. Builders price risk because they have to carry it if things go wrong. In 2026–2027, supply chain impacts on construction cost estimating may be less dramatic than in peak disruption years, but volatility can still appear in specific packages. If you ignore risk allowances, you’ll think tenders are “too high” when they’re actually reflecting real uncertainty. Good estimating accuracy comes from naming risks early, not hoping they don’t land.
Margin: Contractor Margin Adjustments And Market Behaviour
Margins move with market confidence. When contractors are busy, selective, or recovering from tough years, contractor margin adjustments tend to rise. When competition is intense and workloads are thin, margins can compress—but risk pricing may still remain. This is why two projects with similar drawings can price differently depending on timing and bid coverage. For cost estimating implications 2026–2027, you should treat margin as a market variable, not a fixed percentage you copy from the last job.
Cost Drivers For 2026–2027
In Australia, construction costs don’t move for one reason. They move because a few drivers push at the same time, and each one has its own “trigger points.” This section keeps the drivers MECE, so nothing overlaps. For 2026–2027, the goal is simple: watch the leading signals construction costs respond to—then adjust your allowances before tenders surprise you. Think of this as your forecast indicators checklist, not a theory lesson.

Watch Indicators (Titles Only):
- Inputs: Commodity prices, freight, and labour rates
- Market Behaviour: Tender competition and risk pricing
- Money And Demand: RBA settings, inflation expectations, pipeline shifts
- Delivery Friction: Procurement challenges and supply chain volatility
Materials Cost Trend Forecast (Commodities, Logistics, Compliance)
Materials are not one market. Some items track commodity prices closely, while others are driven by local capacity, transport, and compliance specs. That’s why materials cost inflation can ease in one package and spike in another. For 2026–2027, the materials cost trend forecast depends on risk concentrations: imported products with long lead times, energy-heavy manufacturing, and freight-sensitive items. Supply chain volatility still matters, but it tends to show up in specific packages rather than “everything at once.”
What Usually Moves The Needle (Titles Only):
- Commodity-Linked Items: Steel, aluminium, copper-driven products
- Freight And Energy: Transport costs and energy pass-through
- Compliance Specs: Fire, acoustic, NCC changes, and certification requirements
- Substitution Limits: When “swap it out” isn’t practical or approved
Use this building materials cost outlook to decide where you lock pricing early, and where you can safely leave some flexibility.
Labour Cost Trend Forecast (Rates + Productivity)
Labour is often the stickiest cost driver in Australia. Labour rate changes don’t fall quickly because wages and trade shortages don’t reset overnight. On top of rates, productivity matters just as much. If output per hour drops due to rework, sequencing clashes, or supervision pressure, the labour bill rises even when hourly rates look steady. For 2026–2027, the labour cost trend forecast should be read alongside contractor rate changes forecast signals, because subcontractor capacity and workload are tightly linked.
Leading Signals To Watch (Titles Only):
- Wage Pressure: EBA settings and market rate drift
- Shortages: Trades availability by region and project type
- Productivity Drag: Rework, RFIs, and coordination issues
- Program Stretch: Longer jobs increase labour, prelims, and risk
For estimating, labour risk is rarely solved by a single contingency. It’s managed through scope clarity, sequencing, and realistic program assumptions.
Tendering, Risk Pricing, And Margins
Tender prices are not just “inputs plus markup.” They reflect market behaviour—how confident contractors feel, how much work they have, and how risky they think your job is. When construction market confidence is low or insolvency risk is high, risk pricing rises. When bid coverage is thin, contractor margin adjustments often increase because contractors can be selective. This is why tender price indexes in Australia can stay firm even when some materials soften. For 2026–2027, your future construction pricing outlook should include how competition, prelims escalation, and risk transfer are being priced.
What Changes Tender Outcomes (Titles Only):
- Margin Rebuild: After tight years, margins may lift
- Risk Transfer: Unclear scope, tough programs, heavy liquidated damages
- Bid Coverage: Fewer bidders usually mean higher prices
- Prelims Escalation: Longer programs and higher site overheads
If you want better estimating accuracy, treat the ender conditions outlook as a variable, not a constant.
Macro Settings (Rates, Inflation, Demand)
Macro settings set the “temperature” of the whole market. RBA monetary policy affects feasibility, financing costs, and developer appetite. Inflation impacts on building costs show up through wages, materials, and the cost of running a site. Demand also matters: when construction demand shifts toward public infrastructure or specific regions, capacity tightens and pricing lifts. For 2026–2027, the economic drivers for construction prices are less about one headline number and more about the direction of rates, inflation expectations, and pipeline movement.
Macro Triggers That Shift Forecasts (Titles Only):
- Rate Path: Higher rates cool demand and tighten feasibility
- Inflation Expectations: Drives wage deals and supplier pricing behaviour
- Pipeline Swings: Public and private work is changing at the same time
- Confidence: If market confidence turns, pricing behaviour changes quickly
This is where your forecast indicators become practical. When the macro triggers move, you update allowances and procurement timing—before the market forces you to.
Forecasts By Asset Class: Residential, Commercial, Infrastructure
Sector-based construction forecasts matter because each asset class is priced differently. Residential building costs are labour-heavy and sensitive to approvals and housing demand. Commercial building costs lean harder on services and long-lead procurement. Infrastructure cost forecasts depend on public pipeline timing, packaging, and delivery risk. For Australian Construction Cost Trends & Forecasts for 2026–2027, you get a clearer outlook when you treat each sector as its own cost system, not a single national average.
What Changes By Sector (Titles Only):
- Cost Mix: Labour vs services vs civil works
- Procurement Model: Trade-based vs packaged vs program delivery
- Pipeline Sensitivity: Approvals, tenant cycles, and infrastructure budget projections
Residential Construction Cost Trends (2026–2027)
Residential construction cost trends are shaped by two things: the housing supply chain and labour intensity. Volume builds can hold pricing better if suppliers are locked in and designs are standard. Custom homes and renovations often carry more variation because changes, finishes, and site constraints drive rework and slower programs. Approvals and pipeline strength matter too—if demand picks up, trades tighten quickly, and labour rate changes flow straight into quotes. A home building cost forecast in Australia should always separate “standard product” from “custom complexity.”
Commercial Construction Cost Forecasts (2026–2027)
Commercial construction cost forecasts usually swing on services and timing. Mechanical, electrical, and plumbing (MEP) can be a big cost share, and it’s sensitive to lead times, compliance specs, and skilled labour availability. Fitouts also move with tenant upgrade cycles—when businesses refresh spaces, packages like HVAC, fire, and data can price sharply. Procurement challenges are common because many items are specialist-supplied and coordination-heavy. For 2026–2027, a commercial build cost outlook is less about one rate and more about how early you lock packages and how stable your design is.
Infrastructure Budget Projections And Delivery Costs (2026–2027)
Infrastructure budget projections influence costs because public work sets the market workload. When multiple programs run at once, market capacity tightens, and pricing rises, even for private jobs. Packaging matters too—how work is split changes competition and risk. Risk transfer is a key driver: harsh contract terms, tight programs, and unclear interfaces push contractors to price more contingency. Program delays also inflate preliminaries and supervision over time. For 2026–2027, the infrastructure construction cost outlook is closely tied to the construction market.
Regional Construction Pricing Trends: Metro, Outer Metro, Regional
Regional construction pricing trends are mostly about “where the work is,” not “what you’re building.” To avoid mixing sector logic, keep this section focused on location loadings only: travel time, freight, trade availability, and how deep the local subcontractor pool is. In 2026–2027, regional price variation will often come from logistics premiums and labour mobility, especially when supply chain volatility hits specific packages. When you compare state and regional construction costs, you’re really comparing access and capacity.
- Logistics Premiums: Freight, craneage, delivery windows, and longer haul distances add cost, especially for bulky or fragile materials.
- Labour Mobility: If crews must travel or stay away, you’ll see higher rates, allowances, and weaker productivity.
- Subcontractor Depth: Metro areas usually have more trade options; regional towns can price higher when only a few subcontractors can do the work.
- Remote Uplift: The farther from suppliers and labour pools, the more you pay for time, travel, accommodation, and risk.
- Supply Chain Volatility: Delays or shortages often hurt regions first, because replacements and alternatives are harder to source quickly.
- Access And Site Constraints: Tight metro sites add preliminaries; outer metro and regional sites can add mobilisation time and staging costs instead.
Scenario Forecasts For 2026–2027: Base, Upside, Downside
Scenario forecasts help you plan for ranges, not guesses. For Australian Construction Cost Trends & Forecasts for 2026–2027, the smartest approach is to work with three construction cost scenarios in Australia. Each scenario has clear triggers and a matching estimating response, so your numbers stay flexible as conditions change. This future construction pricing outlook is about readiness, not prediction.
- Base Scenario: Costs rise steadily as expected. Triggers include stable RBA monetary policy, manageable commodity prices, and balanced tender competition. Estimating response: use standard escalation allowances and disciplined contingencies.
- Upside Scenario: Costs rise faster than planned. Triggers include higher commodity prices, tighter labour markets, or sudden demand spikes. Estimating response: increase escalation, shorten price validity, and lock high-risk packages early.
- Downside Scenario: Cost pressure eases. Triggers include softer demand, improved supply chains, or easing inflation. Estimating response: maintain contingencies but review margins and competitive tender strategies.
- Rate Shock Trigger: A sudden rate move changes feasibility and tender behaviour. Estimating response: re-test budgets and staging.
- Supply Shock Trigger: Disruptions to materials or logistics. Estimating response: reprice affected packages only.
- Demand Shift Trigger: Pipeline changes between sectors. Estimating response: reassess risk allowances and market pricing.
Cost Estimating Implications 2026–2027 (Action List)
Forecasts only add value when they change how you price work. For Australian Construction Cost Trends & Forecasts for 2026–2027, estimating best practice is about turning cost drivers into clear allowances, not padding numbers. The focus should be on estimating accuracy—understanding where risk sits, when to lock pricing, and how procurement challenges affect timing and margins.
- Set Escalation Allowances: Base escalation on package risk and timing, not a flat project-wide rate.
- Apply Smart Contingency Logic: Tie contingencies to known risks, not “just in case” buffers.
- Time Procurement Carefully: Lock long-lead or volatile packages early where it reduces exposure.
- Review Contract Clauses: Check escalation, rise-and-fall, and risk transfer clauses before pricing.
- Manage Contractor Margins: Recognise when contractor margin adjustments are market-driven, not negotiable.
- Use Value Management Early: Target design and specification choices that reduce risk without cutting scope.
FAQs
Construction cost forecasts are reliable as planning guides, not fixed outcomes. They show likely directions and pressure points based on current data, market behaviour, and economic settings. You should always apply them as ranges and update allowances as conditions change.
Tender prices include more than materials. Labour rate changes, preliminaries, risk allowances, and contractor margin adjustments often stay firm even if some materials soften. This is why building costs don’t fall as quickly as people expect.
Labour is the most persistent driver. Wages, trade availability, and productivity affect almost every package. Even small labour pressures can outweigh savings from materials, especially on longer or labour-intensive projects.
Use forecasts to test escalation allowances, contingency logic, and procurement timing. Apply higher allowances to high-risk or late-procured packages, and avoid using one flat escalation rate across the whole job. This improves estimating accuracy without inflating budgets unnecessarily.
Often, yes—but for different reasons. Regional construction pricing trends are driven by logistics premiums, labour mobility, and subcontractor depth rather than sector type. In some cases, tight metro access and preliminaries can cost just as much as regional travel and mobilisation.
Conclusion
Australian Construction Cost Trends & Forecasts for 2026–2027 show a market that is still shifting, not settling. Costs will move differently by sector, location, and timing, driven by labour pressure, market behaviour, and procurement risk more than headline inflation. The safest approach is not to chase a single forecast number, but to price with ranges, clear assumptions, and flexible strategies. When forecasts are used to guide escalation, contingency, and procurement decisions, they become a practical risk-control tool rather than a budgeting gamble.